TCRBench, and why T-cell specificity models look better than they are
T-cells find infected and cancerous cells by recognizing short peptides displayed on the cell surface by MHC molecules. If you could predict which peptide a given T-cell receptor recognizes, you could design better vaccines, pick better targets for cell therapies, and understand why some patients respond to immunotherapy and others do not. It is one of the more useful open problems in immunology.
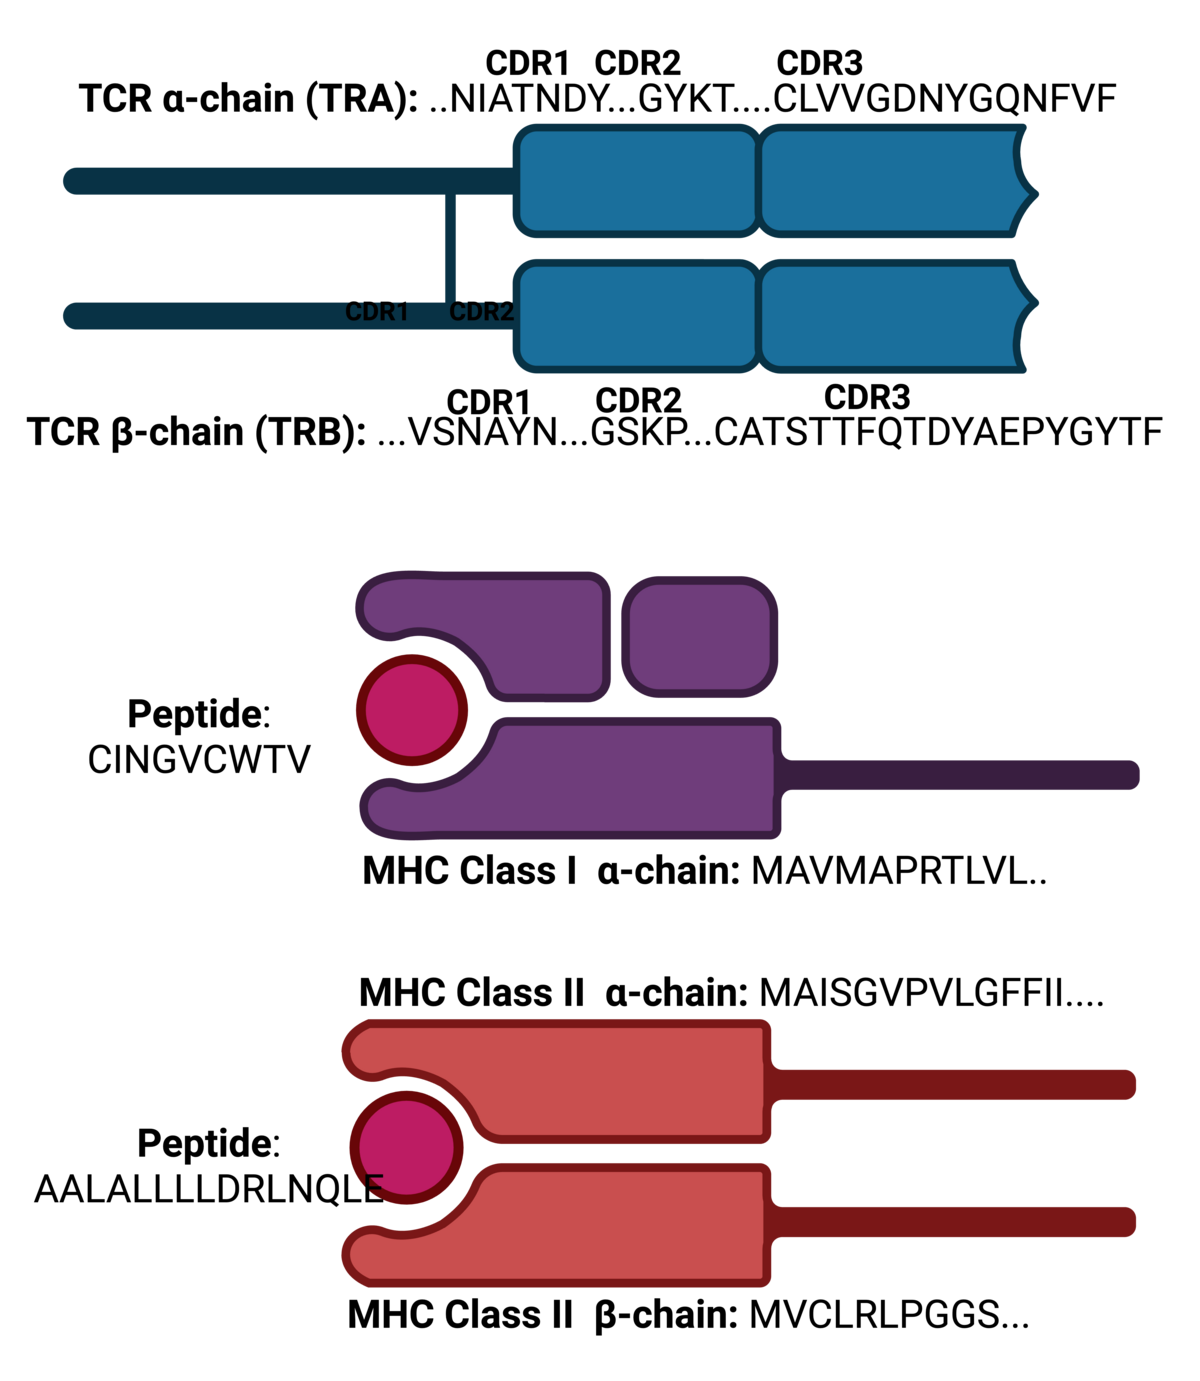
The field has plenty of models for this. The trouble is that most of them are evaluated on epitopes they were trained on. Experimentally validated binding data covers only about two thousand epitopes, mostly from well studied pathogens, so a model can score well by memorizing the handful of targets it has already seen and still be useless on a new one. That is exactly the case that matters in the clinic, where the receptor is known and the target is not.
What is in the benchmark
TCRBench aggregates receptor and epitope data from eight public databases, fifty published studies, and 24,745 bulk repertoire samples, then standardizes and deduplicates it into one dataset.
| Component | Count | Main sources |
|---|---|---|
| TRA sequences | 202.6M | Adaptive bulk, public studies |
| TRB sequences | 3.1B | Adaptive bulk, public studies, TCRdb |
| Mixed TRA/TRB | 359M | iReceptor |
| Paired TCRs | 1.7M | Public studies, VDJdb, McPAS-TCR |
| Peptide-MHC complexes | 4.9M | IEDB, CEDAR |
| TCR-peptide-MHC interactions | 53K | VDJdb, McPAS-TCR |
The shape of that table is the whole problem in miniature. Receptor sequence is abundant, 3.66 billion sequences in total, while measured interactions are five orders of magnitude rarer, and only a fraction of a percent of records carry both receptor chains.
On top of the data sit six tasks, covering the alpha chain, the beta chain, and paired chains, for both MHC classes.
| Task | Samples | TCRs | Alleles | Peptides |
|---|---|---|---|---|
| TRA + pMHC class I | 4,293 | 3,888 | 50 | 460 |
| TRB + pMHC class I | 13,379 | 12,313 | 68 | 528 |
| Paired + pMHC class I | 3,569 | 5,740 | 47 | 414 |
| TRA + pMHC class II | 467 | 307 | 34 | 48 |
| TRB + pMHC class II | 642 | 475 | 35 | 52 |
| Paired + pMHC class II | 413 | 463 | 34 | 44 |
Each task is scored under four conditions of increasing difficulty: unseen receptors against known epitopes, then entirely unseen epitopes, then unseen MHC alleles. Splits are built by clustering receptor and epitope sequences with MMseqs2 and holding out whole clusters, so a test case cannot be a near copy of something in training. Those conditions mirror real situations: a new T-cell clone from a patient sample, a cancer neoantigen nobody has characterized, a patient carrying an MHC allele that is underrepresented in public data.
What the models do
Models rank every candidate peptide for a given receptor, so the metric is retrieval. The chart below reports Recall@10 on MHC class I, averaged across the three receptor configurations.
| Method | Seen | Unseen TCR | Unseen epitope | Unseen allele |
|---|---|---|---|---|
| Random | 16 | 9 | 21 | 73 |
| LSTM | 71 | 70 | n/a | 33 |
| MLP | 67 | 68 | n/a | 22 |
| DeepTCR | 40 | 44 | n/a | 30 |
| TCR-BERT | 20 | 12 | 24 | 74 |
| TULIP | 60 | 60 | 18 | 74 |
| ESM2-QUEST | 64 | 53 | 72 | 96 |
Recall@10 on MHC class I, in percent, averaged over the alpha, beta and paired configurations. The classification models output a distribution over training peptides, so they cannot score an epitope that was not a training label.
Three things stand out. The classification models look strong on familiar epitopes, 67 to 71 percent for the LSTM and the MLP, and are structurally unable to handle a new one. TULIP, a transformer that can score anything in principle, drops from 60 percent on seen epitopes to 18 on unseen ones, which is roughly the random baseline for a pool that size. And ESM2-QUEST, which starts from the ESM2 protein language model and is fine tuned on 100 million sequences from the benchmark before supervised training, holds 72 percent on unseen epitopes, four times TULIP in the condition that matters.
Two caveats on those numbers. Unseen-epitope performance can exceed seen-epitope performance because the candidate pools differ in size, 45 to 62 peptides against 47 to 97, so the conditions are not equally hard. And the class II results are too small to read much into: pools of four to six peptides push almost every method to the ceiling.
The pre-training step is what buys the generalization. Fine tuning the encoder on receptor sequences before supervised training lifts unseen-epitope recall from 66 to 72 percent overall, and on the beta chain alone from 44 to 72.
The dataset, the splits, and the code are open. The work sits in the QUEST repository, with the benchmark on the tcrbench2 branch. This was done with colleagues at the Fred Hutchinson Cancer Center, and it grew out of QUEST, the T-cell specificity project I led in the Warren Lab.